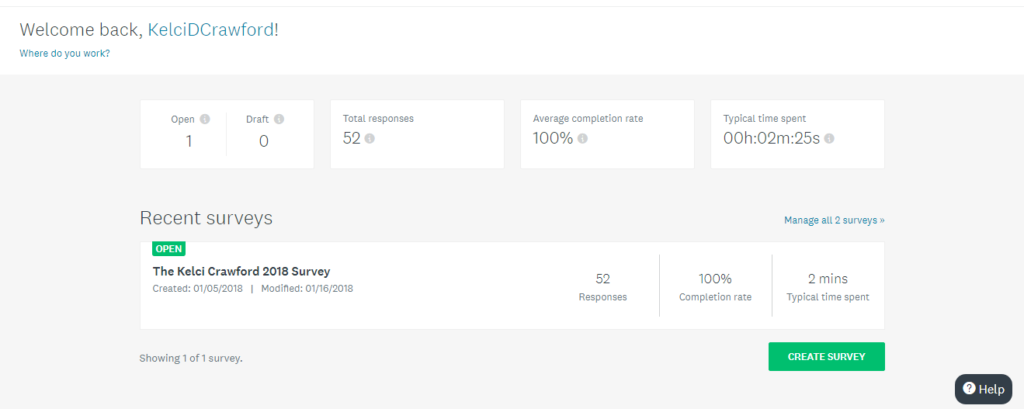
Thank you to everybody who filled out my 2018 survey! There were 52 of you who filled it out. I know that doesn’t sound like a lot of people but it’s 52 more than I thought would actually take the time to do it.
So let’s break down the survey results in this blog post.
The top image is a general overview of the survey itself. When I posted the link, I often said, “This will only take five minutes.” Turns out – it took half that time. Sweet!
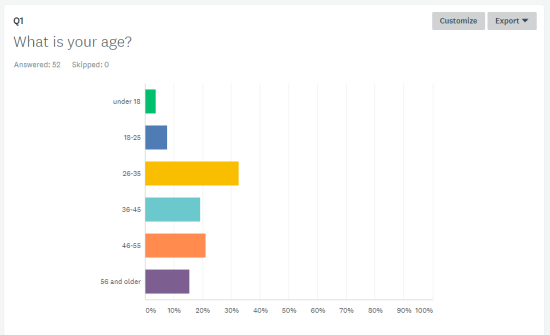
First, it was discovered that most of my readers (who took the survey, anyway) are between the ages of 26 and 35. The number of readers 55 and over surprised me though. I was expecting the reader age to be younger, on average, but it’s good to know this information. Now I feel like I don’t have to watch my language as much anymore.
It’s also unique that most of the readers who did this survey are in the same age bracket as me. I feel like that doesn’t happen often for most creators.
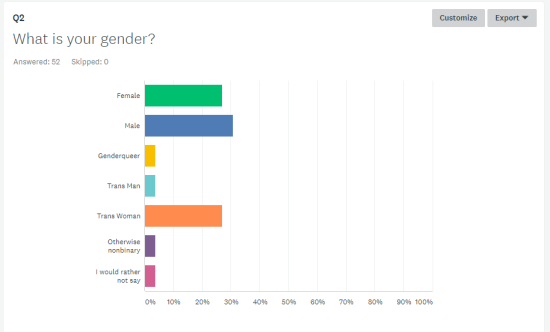
Second, and this is surprising to me: 30% of readers who took the survey are male, 26% are female, 26% are trans women, and the remaining percentages are trans men, nonbinary in some way, or just preferred not to say. I’m legit surprised at the majority three-way split.
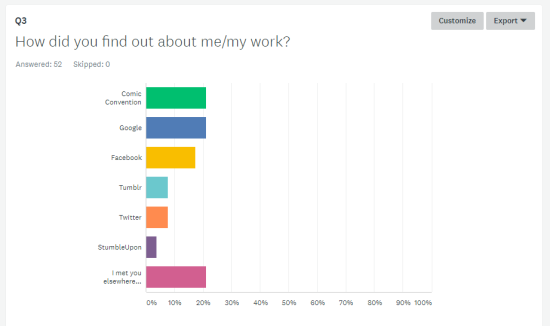
Third, in the survey, people said they found me first through comic conventions, then through a Google search, then by knowing me in some way offline. The Google search answer surprised me most, considering I don’t put a whole lot of effort into SEO or metadata. I DO tag my work, though, so that might have something to do with that.
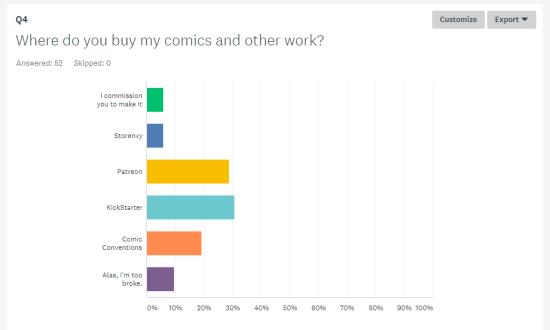
Fourth, I found that the top 3 ways people prefer to show their monetary support is through KickStarter (number 1), Patreon (close second), or buying directly from me at conventions. Storenvy TRAILED in comparison to those three methods. A part of me finds this encouraging, because this year there are plans to do a LOT of KickStarter campaigns (at least one or two of which are Validation-related). However, part of me wonders if I should stay with Storenvy and promote it more, or switch to a different online store method.
At the very least, I’m glad the energy I put into Patreon is paying off. So, yay!
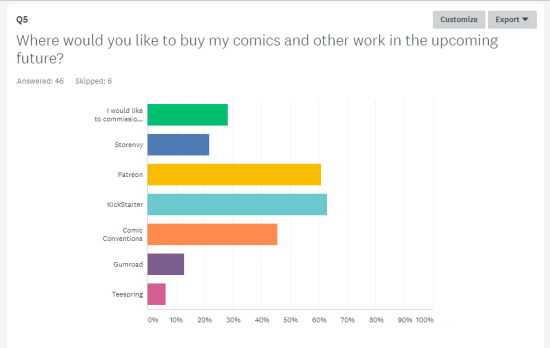
Fifth, speaking of people buying my work in the future, the survey revealed that people would rather get new work from me down the line by supporting KickStarters. Joining Patreon as a patron was a CLOSE second. Third was buying work from me at future conventions. However, the idea of commissioning me to make something was a strong 4th place.
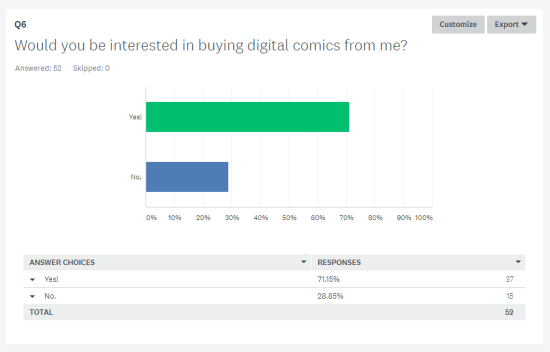
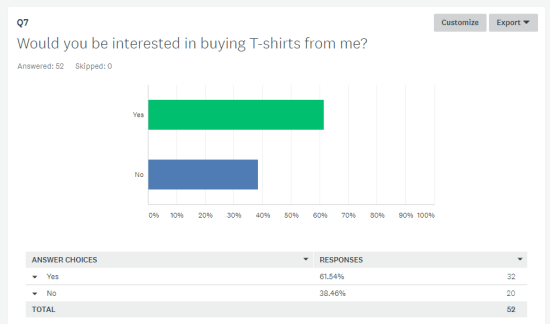
Sixth, and this interested me: people want to buy digital comics and T-shirts from me – but in the previous question, Gumroad and Teespring were dead last in the votes for where people want to buy my stuff.
Maybe there’s something to the idea of finding a new format for my online shop…
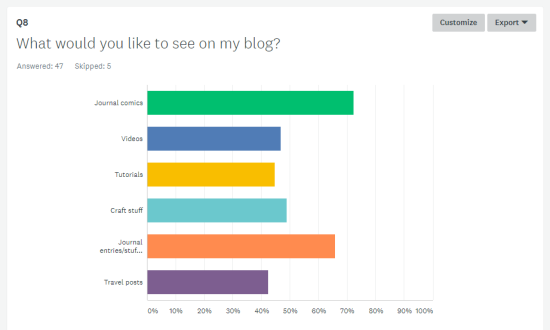
Seventh – this shocked me – on the blog, folks voted they wanted to see more journal comics and journal-type posts. Videos came in third place.
In this survey, some of the questions allowed for comments. This was one of those questions. One comment that I found SUPER encouraging was, “I love it when you post things from big projects you’re working on! Or just random everyday sketches!” I love this comment because now I have an incentive and reason to share the progress I’m making on the comics scripts I’m working on. At least, sharing them outside of Patreon patrons.
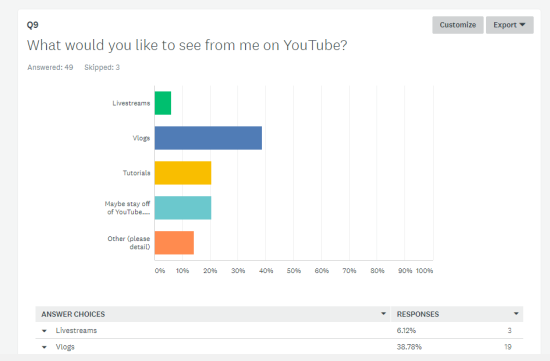
Eighth, on YouTube the people voted they wanted to see more vlogs. Tutorials came in second. And third was “Maybe stay off of YouTube. It’s a mess right now.” At least one vote came in to do vlogs, tutorials, AND livestreams – but livestreams were among the least-voted options.
I wonder if people would vote the same way about podcasts? I wanted to include a question about podcasts, but SurveyMonkey (the platform I used to run this survey) only allowed for ten questions.
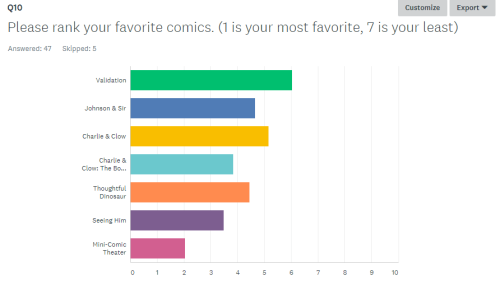
Finally, to the surprise of not me, Validation ranked first as being the comic people like to read the most. What DID surprise me was that Charlie & Clow (and by extension, The Case of the Wendigo, because I forgot to list the latter as an option) came in second! A few years back the second place story was Johnson & Sir. So to see Charlie & Clow climb up in popularity makes me happy.
I had one reader, who filled out the survey, say they didn’t even bother ranking the comics because they love the work I do. For what it’s worth, of the 52 people who took the survey, only 45 actually ranked the comics I make from favorite to least favorite to read.
So what can be taken from these results?
Well, I had the idea to relocate my online store a month or two ago, but I think these survey results have solidified that idea. Because folks do want to get digital comics and T-shirts from me, but don’t want to go outside of Storenvy (to platforms like Gumroad) to get them. At this moment, Storenvy is my online store front, but after this survey I’ll look into changing that.
The other thing I find surprising and encouraging was that most who voted on what I should be posting on the blog left comments saying, “whatever suits your fancy.” But the top two most-popular options were journal comics and journal-type entries. I’m glad that people voted this way because journal entries and comics were something I definitely considered doing, but wasn’t sure people would want to see that. Now I know the readers want to see that stuff!
Readers also want to see more progress on the long-form projects I’ve got going on. THAT makes me happy.
So, look forward to more KickStarter campaigns, more Patreon engagement, more times I’m available to draw commissions for folks, and more personal updates from me here on the blog!
What are you looking forward to the most in 2018? What are your thoughts on podcasts, the thing I didn’t bring up in the survey? Let me know in the comments. I read what you post with an open mind.
Thank you for your support and your feedback!
You. Are. Awesome.
